Data-Warehouse-Power-Bi-Ceramics-World
Ceramics World - Data Warehouse & Power BI
Comprehensive data platform (Python + pandas/SQLAlchemy, Dockerised SQL Server, T-SQL, PowerShell automation, SQL Server Management Studio, Power BI/DAX) that blends Trade Map trade statistics with World Bank macro indicators to understand how Portuguese ceramic exporters compete worldwide. The project demonstrates end-to-end ownership of data ingestion, dimensional modeling, SQL Server automation under Docker, and Power BI storytelling.
 |
 |
|---|---|
 |
 |
1. Executive Summary
- Business need: identify priority markets for HS 69xx ceramics, quantify Portugal’s share, and overlay macroeconomic drivers (GDP per capita, urbanisation, industry growth).
- Solution: SQL Server data warehouse populated via Python/SQL ETL, enriched with 2024 calculation tables for instant KPIs, and surfaced through a Power BI executive dashboard.
- Key capabilities:
- Cleansed
DIM_COUNTRY,DIM_PRODUCT,DIM_DATEdimensions with surrogate keys. - Historical facts for trade, services, and macro series (annual data pinned to
Q4). - 2024 snapshot tables (
CALC_*) containing pre-computed growth, share, tariff, and logistics metrics. - Repeatable load pipeline (
etl/ingest_csv.py,sql/10_staging.sql,sql/20_dimensions.sql,sql/30_facts.sql). - Power BI assets (
Power BI/DAX.md,Power BI/Dashboard.pbix) for interactive analysis.
- Cleansed
2. Index
- Executive Summary
- Index
- Business Context
- Objectives
- Stakeholders and User Roles
- Why This DW Matters
- Solution Architecture
- Source Data Inventory
- Data Modeling Highlights
- Snapshot and KPI Strategy
- ETL / ELT Pipeline
- Repository Layout
- Power BI Deliverables
- Getting Started
- Validation and Testing
- Operations and Maintenance
- Roadmap
- License
3. Business Context
Portuguese ceramics compete globally across tiles, sanitaryware, mosaics, and related HS 69xx segments. Market prioritisation requires a consolidated view of:
- Import/export trends per country and product.
- Services activity (construction) that signals downstream demand.
- Macro drivers explaining consumption power.
- Tactical KPIs (tariffs, logistics, share of wallet) for 2024 decision-making.
4. Objectives
- Unify trade and macro data into a single semantic model optimised for Power BI consumption.
- Quantify performance of Portugal vs global peers, highlighting growth, share, and concentration.
- Enable scenario analysis by surfacing macro correlations and HS-segment breakdowns.
- Provide reproducibility: scripted ETL ensures anyone can rebuild the warehouse end-to-end.
5. Stakeholders and User Roles
| Role | Needs | Assets |
|---|---|---|
| Executive board | Country prioritisation, KPI snapshots | Power BI dashboard |
| Market analysts | Deep dives by HS code or macro driver | Fact tables + DAX measures |
| Data engineering | Repeatable ingestion, QA | etl/, sql/ scripts |
| Trade team | Quick data extracts | SQL views and calc tables |
6. Why This DW Matters
- Speed: Pre-aggregated
CALC_*tables keep dashboards responsive even with heavy KPI logic. - Consistency: Surrogate keys aligned across all layers ensure frictionless joins and prevent naming drift.
- Traceability: Every metric ties back to a specific Trade Map or World Bank dataset captured under
data/. - Scalability: The pipeline is extensible to new HS codes or macro indicators by appending staging views and mappings.
7. Solution Architecture
flowchart LR
    A[Trade Map / World Bank CSVs] --> B[Python Ingestion - etl/ingest_csv.py]
    B --> C[SQL Staging Views - sql/10_staging.sql]
    C --> D[Dimensions - sql/20_dimensions.sql]
    D --> E[Facts and Snapshots - sql/30_facts.sql]
    E --> F[Power BI Model - Power BI/Dashboard.pbix]
- Storage: SQL Server (
CeramicsWorldDB), recreated every load for reproducibility. - Processing: Python (pandas + SQLAlchemy) for ingestion, SQL for transformation.
- Analytics: Power BI with curated DAX measures (
Power BI/DAX.md).
8. Source Data Inventory
| Provider | Dataset | Table(s) | Notes |
|---|---|---|---|
| Trade Map | Importers historic (HS 69xx) | FACT_IMP |
Annual values 2005-2024 (Q4 proxy). |
| Trade Map | Exporters historic (Portugal) | FACT_EXP_PT, FACT_EXP_PROD_BY_PT |
Destination and HS code exports. |
| Trade Map | Importers by segment (6907/6908/6910) | FACT_IMP_SEGMENT |
Country x product intersection. |
| Trade Map | Construction services (imports/exports) | FACT_IMP_SECTOR, FACT_EXP_SECTOR_BY_PT |
Single quarterly lines (world vs Portugal). |
| Trade Map | 2024 exporter/importer snapshots | CALC_EXP_*, CALC_IMP_* |
KPIs: growth, tariffs, distance, rankings. |
| World Bank | GDP per capita (NY.GDP.PCAP.CD) | FACT_PIB |
USD, annual. |
| World Bank | Urban population (SP.URB.TOTL) | FACT_URBAN |
Absolute population. |
| World Bank | Industry incl. construction growth (NV.IND.TOTL.KD.ZG) | FACT_CONSTRUCTION |
Annual percent growth. |
9. Data Modeling Highlights
- Dimensions:
DIM_COUNTRY: ISO3, continent, region, slug for SEO-friendly routing.DIM_PRODUCT: HS 4-digit, section, chapter labels.DIM_DATE: year/quarter pairs with decade label; annual series write to theQ4row to keep joins uniform.
- Facts:
- Trade (
FACT_EXP_PT,FACT_EXP,FACT_IMP,FACT_IMP_PT,FACT_EXP_PROD_BY_PT,FACT_IMP_PROD,FACT_IMP_SEGMENT). - Services (
FACT_EXP_SECTOR_BY_PT,FACT_IMP_SECTOR) referencing onlyDIM_DATE. - Macro (
FACT_PIB,FACT_URBAN,FACT_CONSTRUCTION).
- Trade (
- Calc tables: 2024 KPIs by country/product enabling instant visuals without complex DAX.
Detailed specs live in docs/Modelo_Conceptual.md, docs/Modelo_Logico.md, docs/Modelo_Fisico.md, docs/Modelo_Relacional.md.
10. Snapshot and KPI Strategy
- Every
CALC_*table uses the relevant dimension key as primary key (id_countryorid_product). - Metrics include value/growth deltas, world share, tariff averages, partner distance, rankings, and concentration indices.
- Snapshots are idempotent:
sql/30_facts.sqldrops and recreates them each run to avoid drift.
11. ETL / ELT Pipeline
- Environment config: set
MSSQL_HOST,MSSQL_DB,MSSQL_USER,MSSQL_PASSWORD,DATA_PATH(seedocker/.envtemplate). - CSV ingestion (
python etl/ingest_csv.py):- Scans
data/**.csv. - Generates safe SQL table names (
imports_products_csv_trade_map_list_of_imported_products_for_the_selected_product_ceramic_products_xls). - Loads raw data into SQL Server staging schema.
- Scans
- Staging views (
sql/10_staging.sql):- Cleans country names via
staging.ref_country_lookup. - Normalises HS metadata through
staging.ref_hs_product. - Unpivots annual/quarterly columns, converts percentages to decimals, enforces ISO3 lookups.
- Cleans country names via
- Dimensions (
sql/20_dimensions.sql):- Rebuilds surrogate keys, ensuring only validated ISO3/HS inputs survive.
- Facts and calc tables (
sql/30_facts.sql):- Loads trade, macro, and service facts.
- Creates KPI snapshots.
- Applies referential constraints and
ON DELETE NO ACTION.
12. Repository Layout
data/ # Raw Trade Map and World Bank CSVs
docker/ # Compose files / env samples
docs/ # Conceptual, logical, physical, relational models
etl/ # Python ingestion + helpers
img/ # Dashboard screenshots
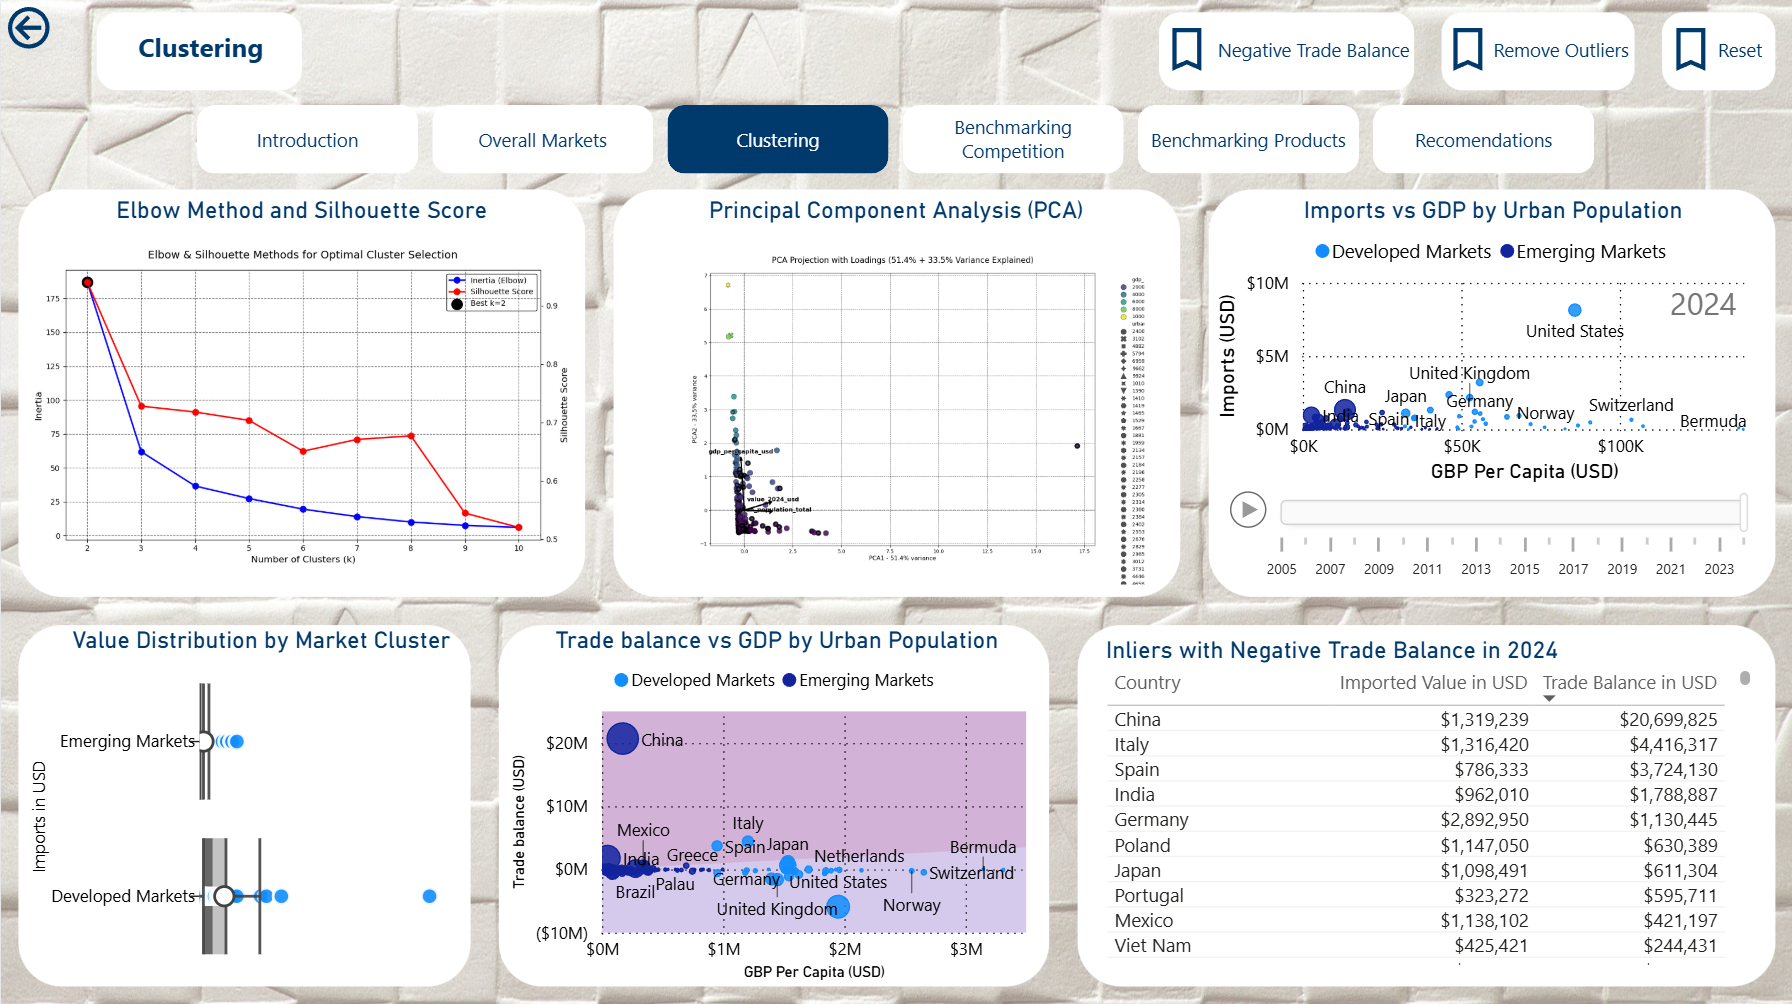
powerbi/ # Exploratory notebooks, clustering, PCA
Power BI/ # DAX measures + Dashboard.pbix
sql/ # 10_staging, 20_dimensions, 30_facts scripts
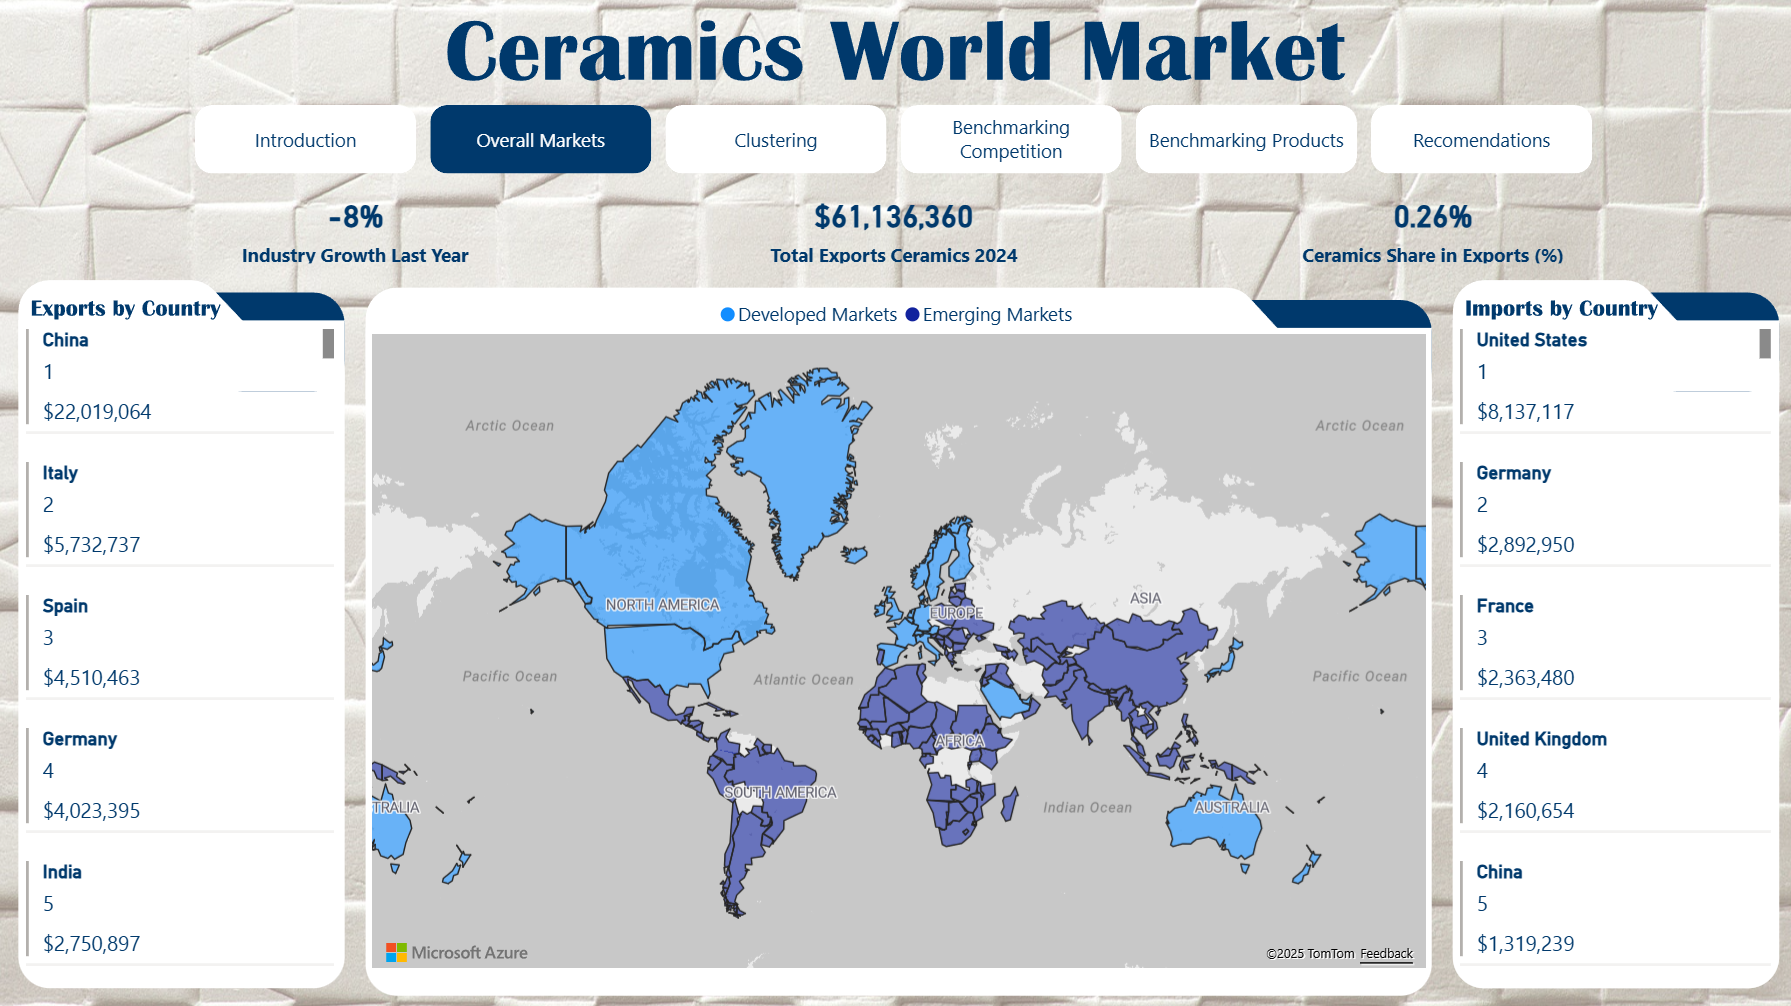
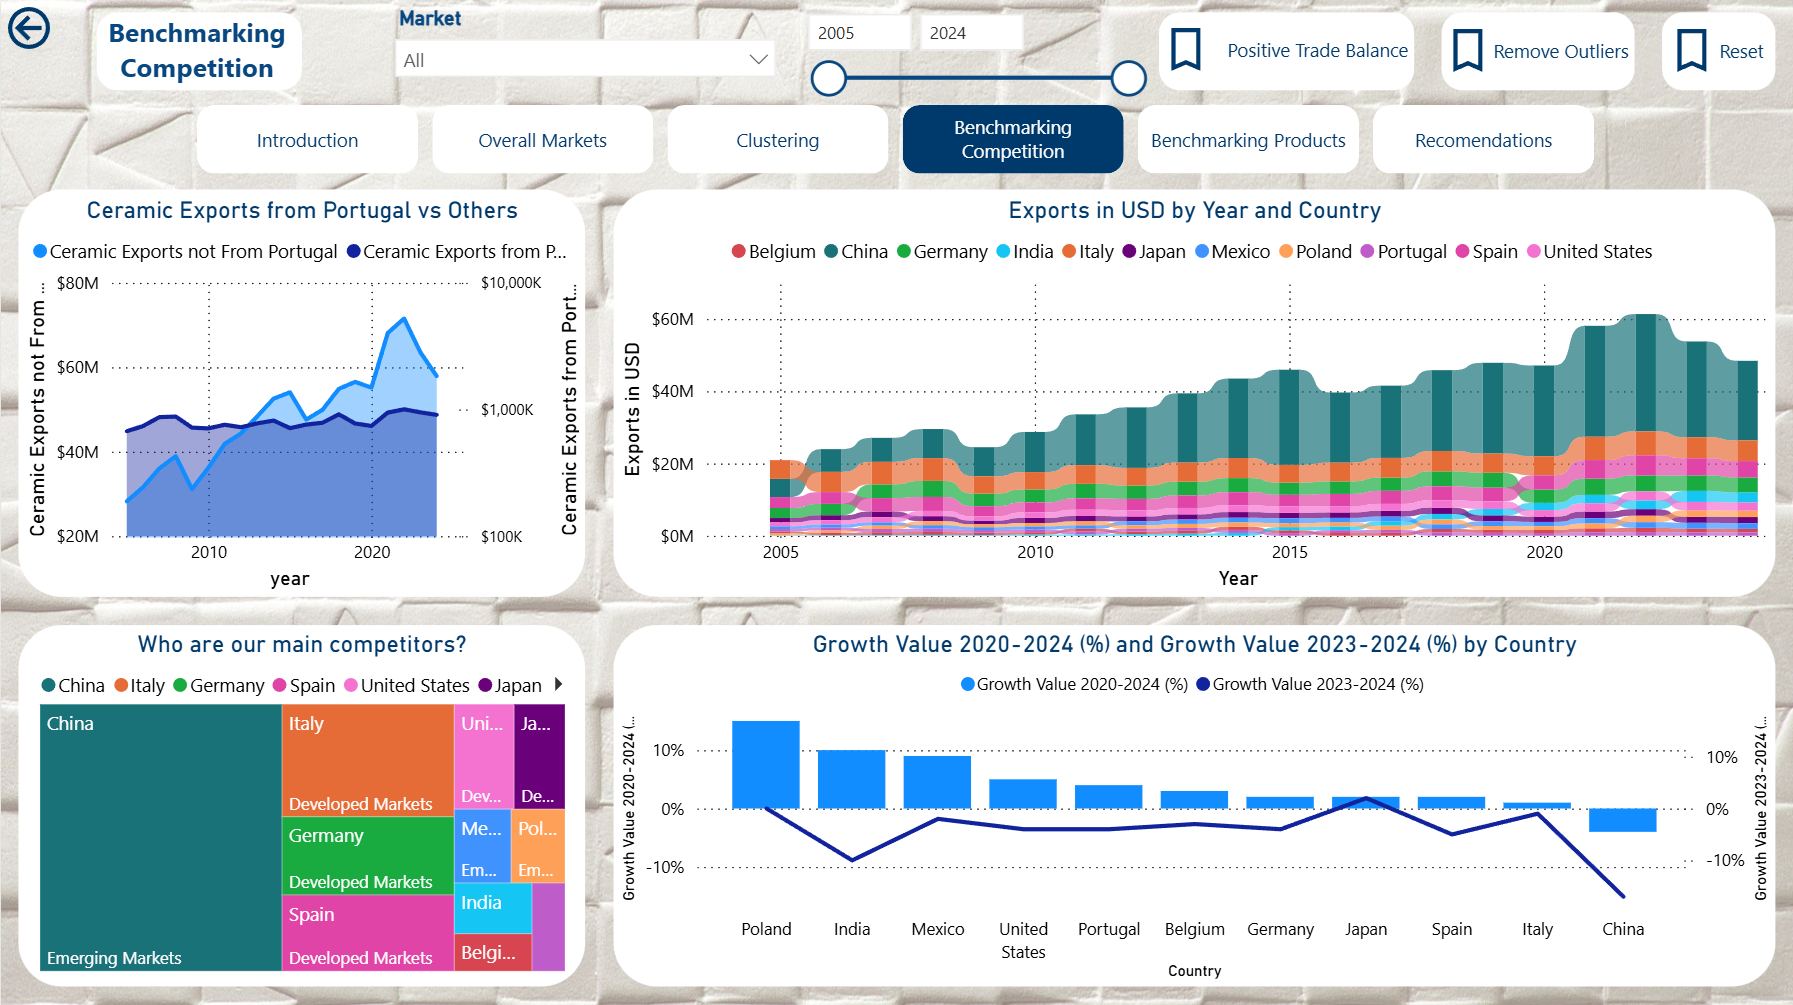
13. Power BI Deliverables
Power BI/DAX.md: curated measures (shares, rankings, clustering, outlier detection) standardising logic.Power BI/Dashboard.pbix: enterprise storytelling with:- Import vs export growth by country.
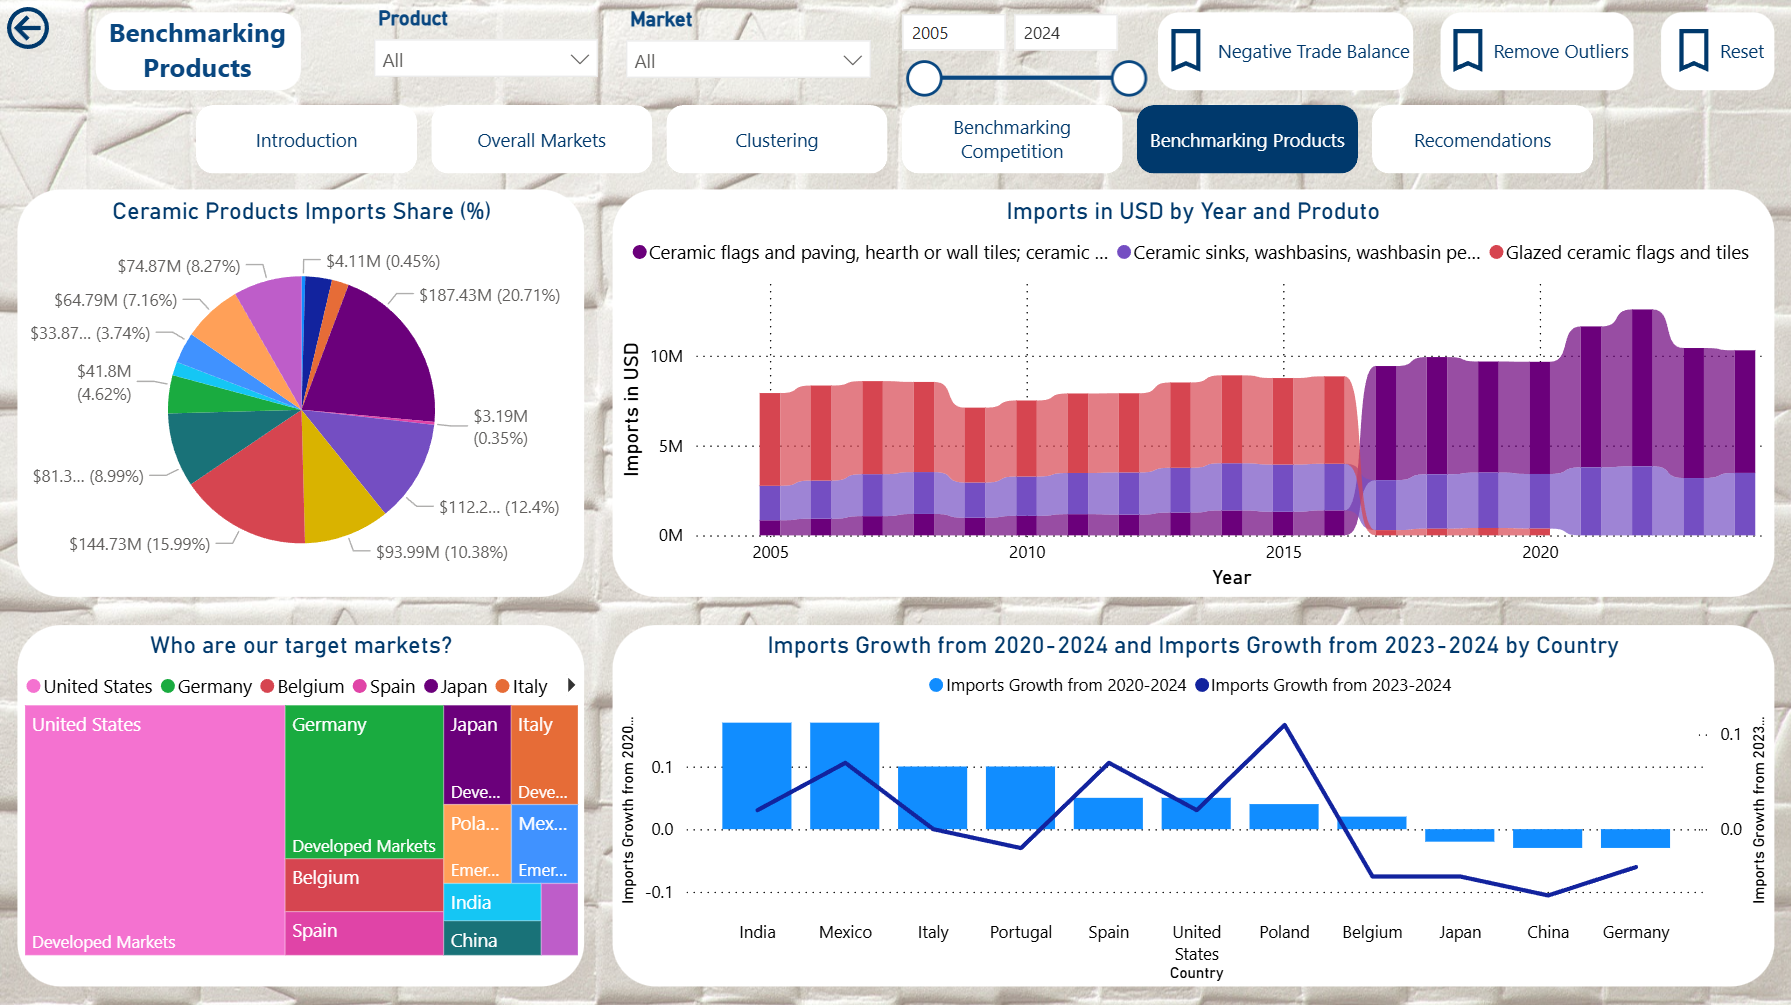
- HS 6907/6908/6910 segmentation deep dives.
- Macro correlations (GDP, urbanisation, construction) vs trade values.
- Callouts powered by
CALC_*KPIs.
14. Getting Started
Virtualised SQL Server with Docker
- Copy
docker/.env, set passwords/volumes, and adjust port mappings if needed. - Provision the SQL Server + loader helper stack:
cd docker docker compose up -d - The compose file virtualises the environment so you can rebuild the DW without installing SQL Server locally. Exposed ports let Power BI, SSMS, or scripts connect as if it were a native instance.
(You can skip this block if you already have an on-prem/Azure SQL Server available.)
Steps
pip install -r etl/requirements.txt- Populate
.env(ordocker/.env) with SQL Server credentials. - Place Trade Map / World Bank CSVs under
data/. - Run ingestion:
python etl/ingest_csv.py - Execute SQL scripts in order:
sqlcmd -d CeramicsWorldDB -i sql/10_staging.sql sqlcmd -d CeramicsWorldDB -i sql/20_dimensions.sql sqlcmd -d CeramicsWorldDB -i sql/30_facts.sql - Open
Power BI/Dashboard.pbix, refresh connections, publish/report.
SQL Server Management Studio (SSMS)
- Use SSMS to connect to
CeramicsWorldDB(local or Docker-exposed) for ad-hoc queries, data validation, and performance monitoring. - Scripts in
sql/can be executed directly from SSMS if you prefer GUI-based deployments oversqlcmd.
15. Validation and Testing
- Row-count checks: staging vs DW after each load (see
sql/30_facts.sqlcomments for expectations). - Referential integrity: enforced via foreign keys; load scripts fail fast on orphaned ISO3/HS codes.
- Metric sanity: compare
CALC_*values with Trade Map CSVs (spot-check Portugal and top importers). - Power BI refresh: confirm no relationship warnings post-refresh.
16. Operations and Maintenance
- Q4 alignment: all annual values map to the
Q4row inDIM_DATE; new years require only appending staging data. - Snapshots: rerun
sql/30_facts.sqlwhenever new Trade Map 2025+ files arrive to regenerate KPIs. - Extensions:
- Add HS codes by enriching
staging.ref_hs_productand re-running ingestion. - Add macro indicators by creating new staging views and plugging them into
sql/30_facts.sql.
- Add HS codes by enriching
17. Roadmap
- Automate SQL deployment via
Invoke-Sqlcmdor GitHub Actions. - Add anomaly detection measures (seasonal ARIMA) to
powerbi/. - Integrate logistics/tariff APIs for near real-time snapshots.
- Publish semantic model to Fabric or Power BI Service as a certified dataset.
18. License
Educational project released under the MIT License.